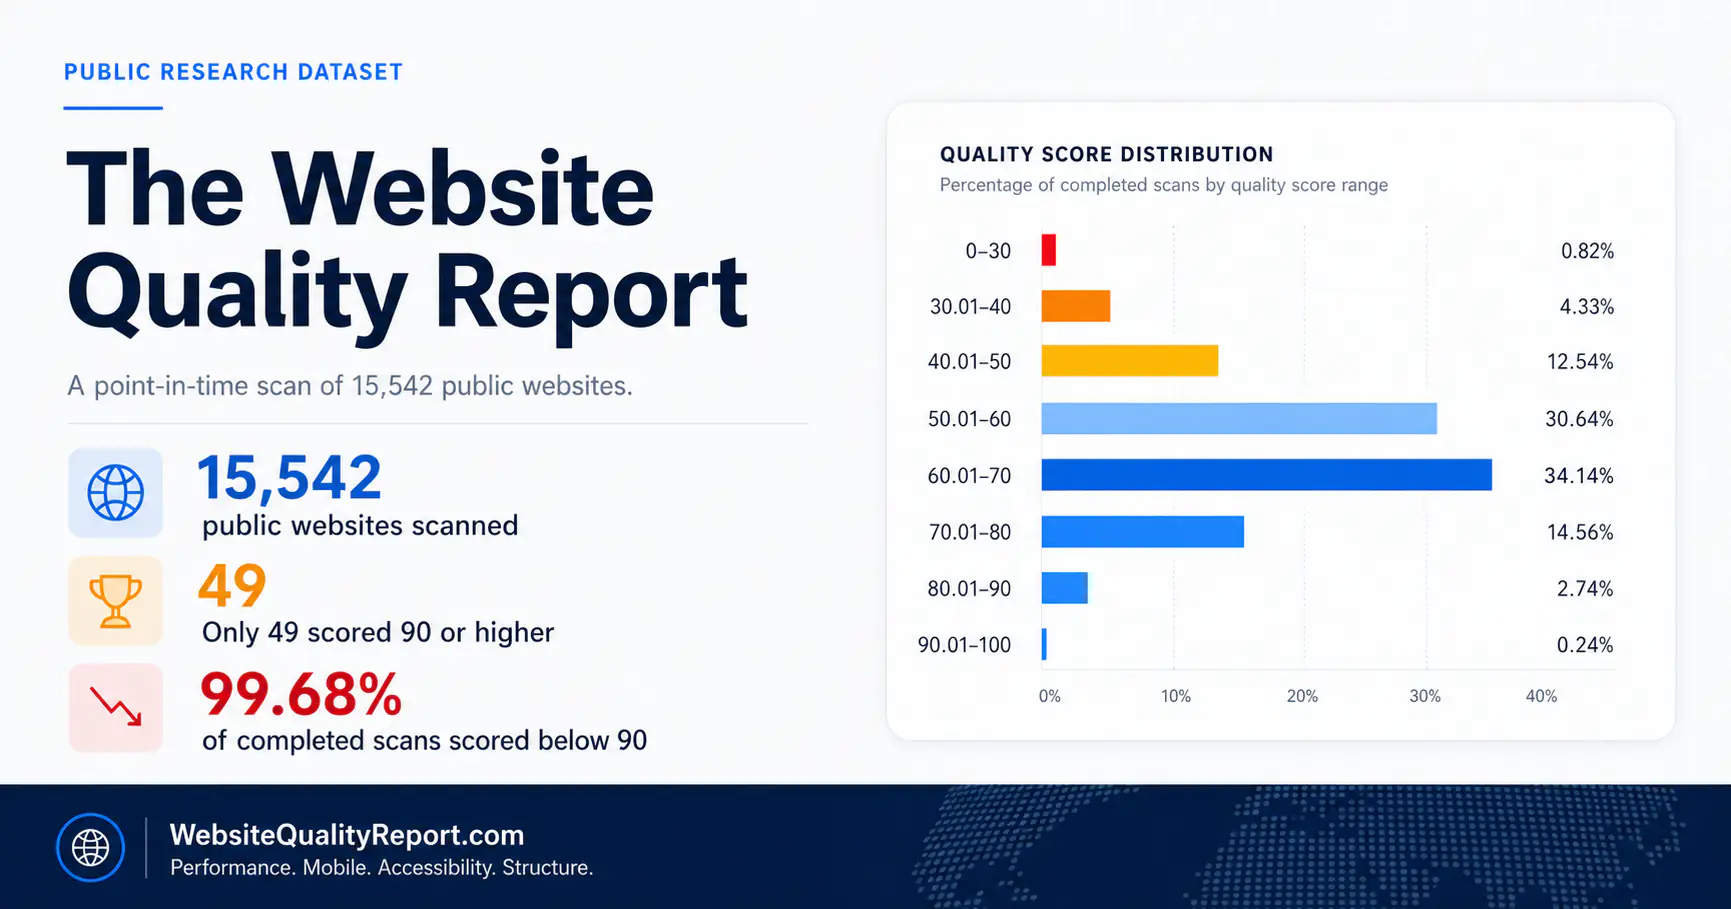
Only 49 out of 15,541 completed scans scored 90 or higher.
Media resource
Media summary
The Website Quality Report is based on a point-in-time scan of 15,542 public websites. The report identifies broad measurable patterns across overall site quality, performance, mobile experience, load time, accessibility issues, and structure health.
The report is intended for citation, analysis, and public discussion. It is not intended to shame individual businesses, assign blame to specific vendors, or explain the cause of any single result.
Key findings
Main findings for quick reference
99.68% of completed scans scored below 90.
The average overall Site Score was 60.
The median overall Site Score was 61.
62.60% of completed scans took more than 5 seconds to load.
25.38% took 10 seconds or longer.
77.74% had at least one accessibility issue.
21.96% had 10 or more accessibility issues.
63.15% had a mobile score under 70.
31.68% had structure health under 70.
Suggested story angles
Possible angles for coverage
Business owners are judging websites by the wrong things
Most business owners can judge how a website looks. They usually cannot tell whether it loads quickly, works well on mobile, avoids detectable accessibility issues, or has strong underlying structure.
Website quality problems appear across multiple signals
The findings were not isolated to one metric. The scan found issues across overall Site Score, load time, mobile score, accessibility issue counts, and structure health.
The hidden side of website performance
A website can look acceptable on the surface while still underperforming on technical and structural signals that affect usability, accessibility, and visibility.
Interpretation
What the report does and does not claim
The report does show
- Point-in-time scan results across 15,542 public websites.
- Broad patterns in overall Site Score, load time, mobile experience, accessibility issue counts, and structure health.
- A public dataset with business names and phone numbers removed.
- Methodology notes explaining how to interpret the data.
- What was measured →
The report does not prove
- Why any individual website performed poorly.
- Whether a website was professionally built.
- How much was paid for any website.
- Who built any specific website.
- Whether a specific website produces business results.
Source files
Download source materials
Public Dataset CSV
Public scan-level dataset export with business names and phone numbers removed.
Analysis Summary CSV
Summary metrics, distributions, and threshold findings used throughout the report.
Methodology Notes CSV
Plain-language methodology notes and limitations for interpreting the results.
Full Excel Workbook
The complete source workbook used to generate the downloadable CSV files.
Suggested citation
Suggested citation
The Website Quality Report. Produced by Trevor Hunter / FOCUS. WebsiteQualityReport.com.
When referencing the dataset, describe it as a point-in-time scan of 15,542 public websites.
Press image
Press image
A share image is available for use when referencing the report.
Download Press Image (JPG) Download WebP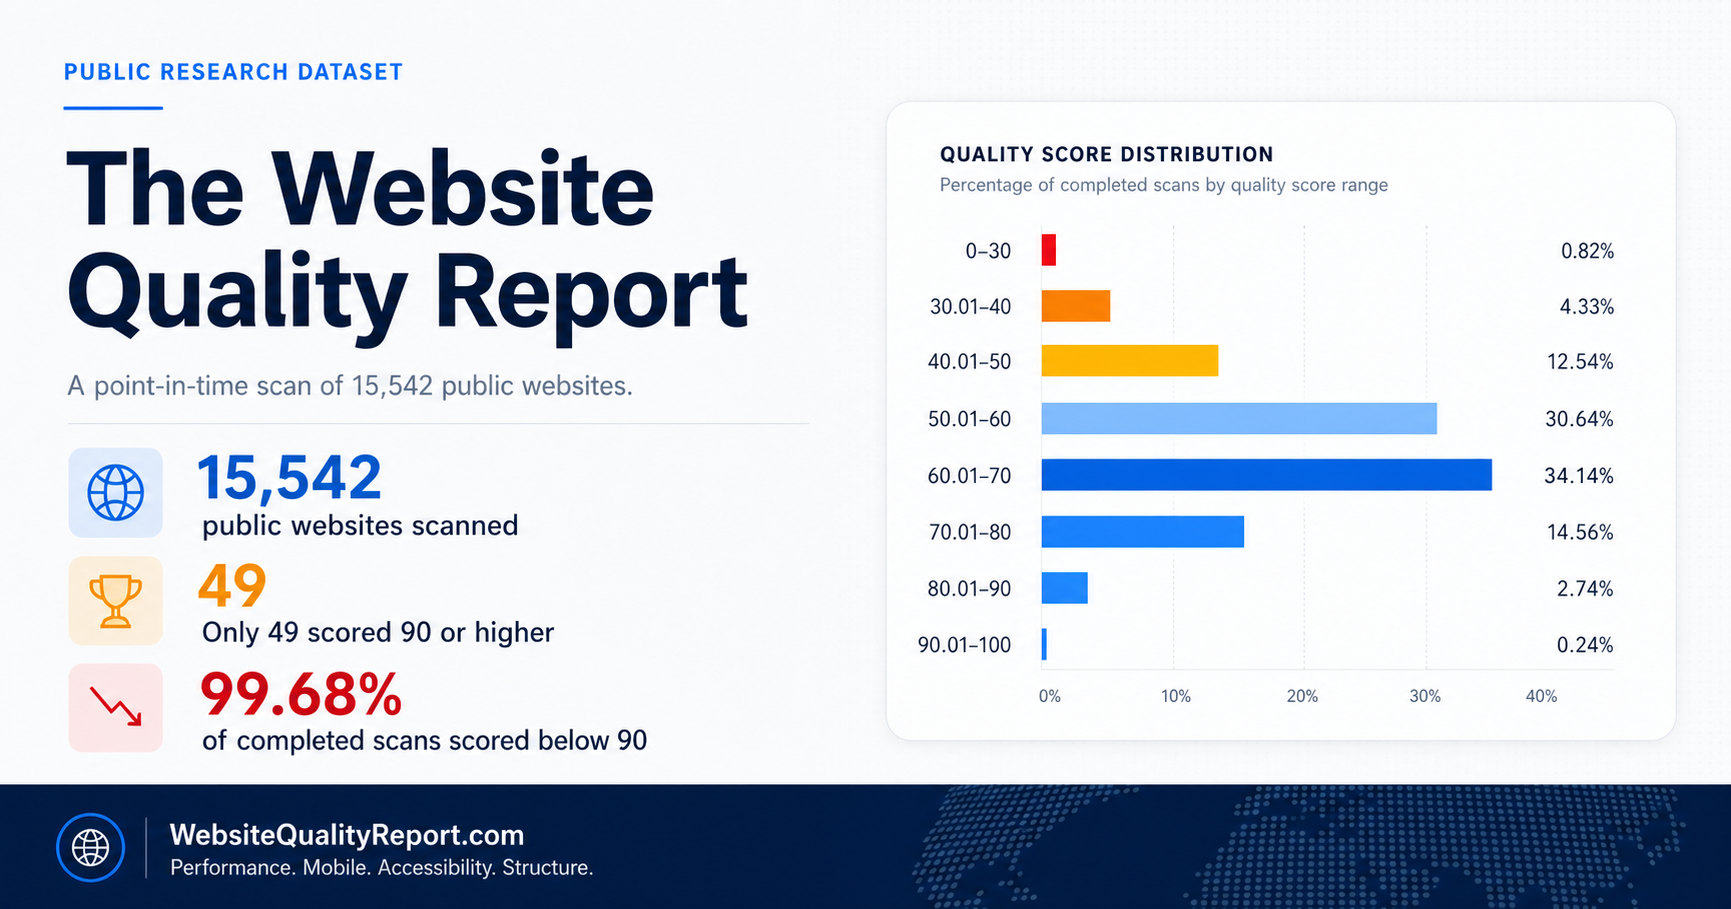